In 2020, the COVID-19 pandemic sent shock waves through the American health care system. While elective procedures came to a standstill, hospitals and other facilities had to increase spending to account for COVID-19 patients. The lockdowns continued to wreak havoc on health care spending, with millions of people losing jobs and consequently, their health coverage.
Nine Key Insights From CMS’ Health Care Spending Actuarial Report
5 min read Premium comments
#centersforMedicareandmedicaidservices#healthcarespending
Recently the Centers for Medicare and Medicaid Services (CMS) released its health care spending actuarial report for 2019. While 2019 may seem like a lifetime ago, this snapshot of the U.S. health care system provides important insight from a time before COVID-19. Notably in 2019, U.S. health care spending was 17.7% of the entire U.S. gross domestic product.
Below we will dive into CMS’ health care spending actuarial report for 2019 and provide our nine key insights. Click the following press release, “CMS Office of the Actuary Releases 2019 National Health Expenditures,” for the full article including links to data and supporting information.
Future reports from CMS will provide greater insight into the impact of COVID-19 on health care spending. CMS stated, “Future reports for 2020 forward will measure health expenditures based on the latest available data and will reflect the impacts of the pandemic on total health care spending as well as on the distribution of spending among the services, payers, and sponsors of health care.”
1. There has been steady growth in national health care spending for four consecutive years.
According to the report, U.S. health care spending increased 4.6% to reach $3.8 trillion in 2019. This growth was comparable to the 2018 rate of growth of 4.7%. In 2019, U.S. health care spending accounted for 17.7% of U.S. gross domestic product, compared to 17.6% in 2018.
Keep in mind that after the passage of the Affordable Care Act in 2010, national health care spending decreased from 17.3% to 17.2% in 2011 and 2012. Its lowest point during the past 10 years was reached in 2013 when it was 17.0%. Since 2016 it has remained fairly consistent.
In 2019, 61% of total national health care spending included hospital care, physician and clinical services, and retail purchases of prescription drugs. This growth was offset by lower expenditures for the cost of health insurance. A decrease attributed to the suspension of the health insurance tax in 2019.
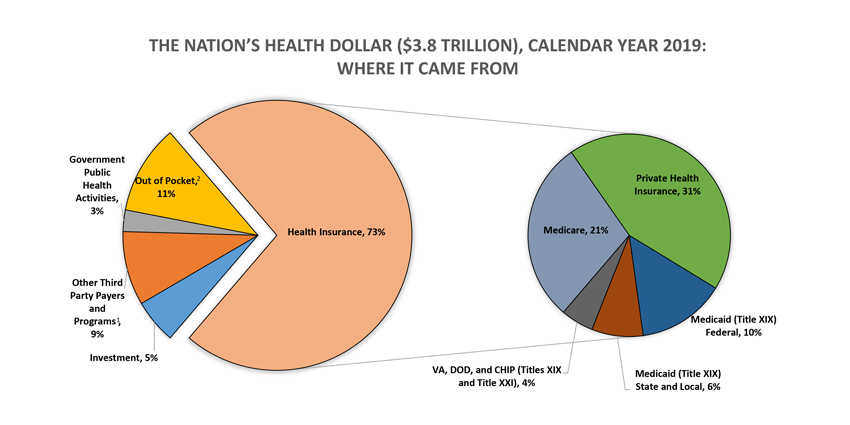
2. Of the $3.8 trillion spent on health care, a majority comes from health insurance.
In 2019, the United States spent $3.8 trillion on health care. A majority (73%) of that spending came from health insurance. This included private health insurance (31%), Medicare (21%), Medicaid (16%), and other programs (4%).
3. We spend more on health care, per capita, then we spend on food and clothing, per capita.
Per capita health care spending was $11,582 in 2019, or $453 higher than in 2018. By comparison, according to the Bureau of Labor Statistics September 9, 2020 report, Americans spent $8,169 per capita on food and $1,883 on apparel and services in 2019.
Health care spending was higher in 2019 than food and clothing, combined.
4. Private business health care expenditures growth rates slowed to 2015 rates.
In 2019, the amount spent by private businesses on health care increased by 3.7%. A significant decrease from the 5.7% growth in 2018. The report authors note that this was the “slowest growth rate since 2015.”
Employer-sponsored private health insurance premiums account for a majority (76%) of private business’ health care costs. In 2019, this category only grew 3.9%, a little over half of the 6.3% growth in 2018.
5. Hospital spending rose faster than physician and clinic health care spending.
Hospital spending accounted for 31% of total health care spending in 2019. It grew by 6.2% in 2019 to $1.2 trillion, faster than its 4.2% growth in 2018. Price increases did not contribute to the growth of hospital spending. In 2019, hospital prices grew 2.0%, less than the 2.4% increase in 2018. Non-price factors such as the use and intensity of services did contribute to the growth of hospital spending in 2019. Non-price factors increased 4.2% in 2019, a jump from 1.8% in 2018.
Total spending for physician and clinical services grew 4.6% in 2019 to $772.1 billion and accounted for 20% of all health care spending. Price increases did not significantly contribute to the growth of physician and clinical services expenditures. In 2019, prices increased similar to 2018 rates (0.8%).
Spending for personal health care includes health care goods and services. In 2019, spending for personal health care accounted for 84% of total health care spending. It grew 5.2% in 2019, faster than the 4.1% increase in 2018. CMS stated, “The faster growth in personal health care spending was driven largely by growth for hospital care, retail prescription drugs, and physician and clinical services.”
6. Private health insurance spending growth decelerated.
Private health insurance expenditures increased 3.7% in 2019 to reach $1.2 trillion, slowing down from the 5.6% increase in 2018.
Driving this deceleration was a 7.9% decrease in the net cost of private health insurance. What caused this decrease? In 2019, the health insurance tax was suspended. Created by the Affordable Care Act, the health insurance tax (or fee) is imposed on entities that provide health insurance for United States health risks.
This decrease may continue. While this tax will return in 2020, it was repealed for calendar years beginning after December 31, 2020.
7. Medicare spending growth remained steady.
Medicare spending grew 6.7% in 2019, compared to 6.3% in 2018. The increase in 2019 is a result of growth in Medicare private health plan spending, which increased 14.5% after growth of 12.6% in 2018.
Medicare enrollment growth remained consistent in 2019, rising 2.6%, the same as in 2018.
Medicare spending per enrollee increased 4.0% from 2018.
Fee-for-service Medicare expenditures growth decelerated to 2.2%, less than the 3.0% growth in 2018.
Total Medicare expenditures reached $799.4 billion in 2019, which was 21% of total health care spending.
8. Retail drug spending growth rates accelerated in 2019.
Retail prescription drug spending accounted for 10% of total health care spending in 2019. In 2019 retail prescription drug spending increased while prices decreased. According to report authors: “Growth in retail prescription drug spending accelerated in 2019, increasing 5.7% to $369.7 billion, compared to 3.8% growth in 2018. In 2019, faster growth in the use of prescription drugs as measured by the number of prescriptions dispensed helped to drive the increase in total retail prescription drug spending growth, while retail prescription drug prices declined by 0.4%.”
9. Out-of-pocket health care spending continues to grow.
While health insurance accounts for a majority (73%) of health care spending, out-of-pocket health care spending accounts for 11% of health care spending, the next largest percentage of spending. Out-of-pocket spending includes co-payments, deductibles, and any amounts not covered by health insurance. It is impacted by enrollment in high deductible health plans and the number of uninsured people who pay out-of-pocket for health care costs.
In 2019, out-of-pocket health care expenditures accounted for the largest category of household spending (38%). Out-of-pocket spending grew 4.6% in 2019 to $406.5 billion. An increase over 2018’s 3.8% growth. During this time, household contributions to employer-sponsored private health insurance premiums (accounting for 27% of household spending) dramatically increased by 6.3% from 2.9% growth in 2018.
React:
Discussion
This is a fascinating development. In my practice we've seen similar outcomes with the revised protocol. The key differentiator seems to be patient selection criteria. Has anyone else noticed the correlation with BMI thresholds?
Great point. I'd push back slightly on the conclusion, the sample size in the cited study is too small to draw population-level inferences. That said, the directional signal is compelling and worth a larger RCT.
We implemented a similar approach last year. Early results are promising but we're still gathering 12-month follow-up data. Happy to share our protocol if anyone is interested.
Join the conversation
Orthopedic professionals are discussing this. Sign in and upgrade to read every comment and add your voice.