On May 8, 2013, the Department of Health and Human Services (HHS) released data showing significant variation across the country and within communities in what hospitals charge for common inpatient services, including orthopedic services.
CMS Lifts Veil From Hospital Charges
3 min read Premium comments
Secondary
“Currently, consumers don’t know what a hospital is charging them or their insurance company for a given procedure, like a knee replacement, or how much of a price difference there is at different hospitals, even within the same city, ” said DHS Secretary Kathleen Sebelius. “This data and new data centers will help fill that gap.”
Web Posted Data
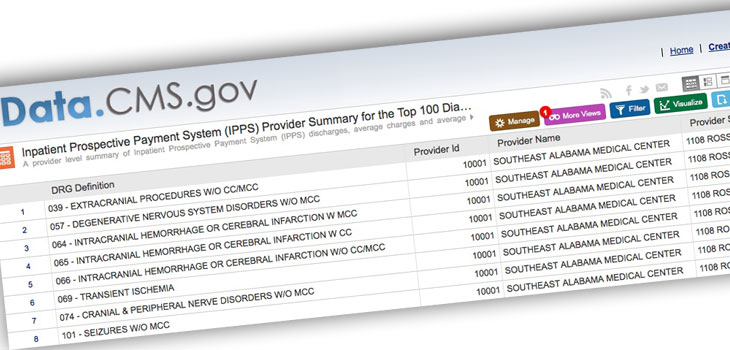
The data posted on the Center for Medicare and Medicaid Services’ (CMS) website include information comparing the charges for services that may be provided during the 100 most common Medicare inpatient stays. Hospitals determine what they will charge for items and services provided to patients. These charges are the amount the hospital generally bills for an item or service.
Journalists across the country quickly jumped on the data and ran local stories showing wildly different prices for the same procedures in their communities.
For example, the HHS announcement showed that average inpatient charges for services a hospital may provide in connection with a joint replacement range from a low of $5, 300 at a hospital in Ada, Oklahoma, to a high of $223, 000 at a hospital in Monterey Park, California.
Even within the same geographic area, hospital charges for similar services can vary significantly. For example, average inpatient hospital charges for services that may be provided to treat heart failure range from a low of $21, 000 to a high of $46, 000 in Denver, Colorado, and from a low of $9, 000 to a high of $51, 000 in Jackson, Mississippi.
Charges, Not Reimbursement
Often missed was one giant caveat. Payers rarely pay what hospitals charge.
PearlDiver Technologies, Inc.’s senior analyst, Scott Ellison, said within the major orthopedic procedures, “We have seen a discrepancy among charges across the U.S. for some time. The variation can occur between two hospitals within miles of each other. Geographically the variation is quite pronounced. For example, hospital charges for a total knee replacement average $41, 774 in the Midwest for Medicare patients. The charges for the same procedure average $64, 660 in the western portion of the U.S. It must be noted though, these are charges and rarely the amount actually paid to the hospital.”
In those same regions Ellison cited, the difference in Medicare reimbursement for a total knee replacement is not so dramatic. “In the Midwest the average reimbursement is $11, 549 and the average reimbursement in the West is $13, 436, ” added Ellison.
Ellison said charges can have varying implications depending on how a patient plans to pay for their procedure. “Patients paying the full amount without insurance would clearly see the greatest impact. For these patients especially, transparency in what they will be charged at different hospitals is extremely important.”
Data Centers
To make these data useful to consumers, HHS is also providing funding to data centers to collect, analyze, and publish health pricing and medical claims reimbursement data. The data centers’ work helps consumers better understand the comparative price of procedures in a given region or for a specific health insurer or service setting. Businesses and consumers alike can use these data to drive decision-making and reward cost-effective provision of care.
The HHS press release noted that the Affordable Care Act also makes available tools to help consumers, Medicare, and other payers get the best value for their health care dollar. “Medicare is beginning to pay providers based on the quality they provide rather than just the quantity of services they furnish by implementing new programs such as value-based purchasing and readmissions reductions. HHS awarded $170 million to states to enhance their rate review programs, and since the passage of the Affordable Care Act, the proportion of insurance company requests for double-digit rate increases fell from 75% in 2010 to 14% so far in 2013, ” stated the release.
To view:
React:
Discussion
This is a fascinating development. In my practice we've seen similar outcomes with the revised protocol. The key differentiator seems to be patient selection criteria. Has anyone else noticed the correlation with BMI thresholds?
Great point. I'd push back slightly on the conclusion, the sample size in the cited study is too small to draw population-level inferences. That said, the directional signal is compelling and worth a larger RCT.
We implemented a similar approach last year. Early results are promising but we're still gathering 12-month follow-up data. Happy to share our protocol if anyone is interested.
Join the conversation
Orthopedic professionals are discussing this. Sign in and upgrade to read every comment and add your voice.